
Skeleton: Runtime Evidence Beats Architecture Guesswork
Follow ML-Affairs On LinkedIn
Open the ML-Affairs page and follow it directly, or use the LinkedIn widget below.
This article is still being expanded. Two walkthrough videos are planned; the article artwork and embedded Skeleton report below are already live for review.
The first real pain of AI-assisted coding is not getting code; it’s keeping up with it.
At the beginning, this sounds like a ridiculous complaint. The model writes the boilerplate. It fills in the tests. It suggests a refactor. It wires a command. It does the boring part quickly, and suddenly the project moves faster than it used to.
Then the project becomes large enough that speed turns into a different problem.
You are not asking, “Can I generate this?”
You are asking, “Do I still understand what I generated?”
The Chore Nobody Sells With Vibe Coding
Vibe coding is the trend everyone is fixated on right now.
And I get it. Fast generation is useful. The friction of trying an idea drops dramatically: a feature, a refactor, a test, a CLI command, a UI panel, or a background worker can appear quickly enough that the whole project starts moving differently.
But there is a very unglamorous problem sitting right behind the excitement:
The faster the code appears, the faster your mental model goes stale.

When a project is small, the default answer is simple: go and read the code.
That answer stops being serious once the codebase grows. In a large system, especially one with unclear boundaries, loose functions, overloaded files, and scattered ownership, “just read the code” becomes a strangely optimistic suggestion.
It is not that reading code is useless–of course it’s not. But source code tells you what could happen. It does not automatically show you what did happen in the workflow you care about.
And this matters more when an LLM helped create the code.
The model can create modules and classes. It can write tests. It can refactor. It can even explain what it thinks it built. But that does not mean the system’s runtime behaviour is now obvious to you, or to the model. A class hierarchy can look tidy and still hide a surprising path. Encapsulation helps organize the code, but it does not tell you which objects were instantiated, which adapters were crossed, which dependencies appeared, or which branch actually ran in the scenario you care about.
That was the problem I ran into.
Why I Started Building A Harness
For the last year I have been building a private local AI assistant workbench called Promet. The name is a nod to Prometheus: the idea is not just to call a local model, but to build the shell around it that makes local model interaction useful, controllable, and inspectable.
I am not ready to make the repository public. It is still too much of a working system, with too many rough edges and too many design decisions still being tested. But the work has already taught me something worth sharing publicly.
The hard part is not only calling a model.
Building it myself has been useful precisely because the easy parts are not the educational parts. You can wire a model call quickly. What you cannot borrow as easily is the product judgement around context ownership, prompt construction, durable threads, tool registries, staged tool routing, MCP connectors, approval gates, evidence records, voice state, progress events, UI state, traces, and the awkward boundaries between all of them.
Call it the control layer. Call it the harness. Call it the product boundary around the model.
That boundary is where the applied AI work becomes real.

Promet walkthrough: the local AI harness that made the problem visible
This slot is for a short walkthrough of Promet: the local model runtime, thread and memory state, tool routing, approvals, evidence records, streaming and voice boundaries, and why the harness around the model became the product surface.
I am building a harness so that you do not have to learn the hard way how difficult a harness really is.
I am not training frontier models in Promet. That is a different discipline. But I do not think that makes the work shallow. A useful AI product still has to decide what the model may see, what it may do, how tool actions are validated, how results become evidence, how voice sessions behave, how the user can interrupt, how context is compacted, and how a future reviewer can understand what happened.
That is not peripheral work. For many applied AI systems, that is the product.
It has been revealing. I have learned a lot about what these models can do, where they are genuinely useful, and where they need much stronger boundaries than people like to admit.
But something became obvious very quickly: I could not follow the code anymore.
The Naive Assumption
When I started, I had a very naive assumption.
I thought: fine, the LLM can write code, but I will still review the pull requests. I will read the diffs. I will keep the architecture in my head. I will know what is happening.
After the tenth pull request, that belief started to look very fragile.
The issue was not only speed. It was style and ownership.
The way the LLM naturally wrote Python code was not always close to the object-oriented, actor-owned design I wanted. It had a tendency to create loose modules, loose functions, overloaded files, and little islands of behaviour that looked harmless locally but made the system harder to reason about globally.
One example stayed with me. I had multiple assistant profiles being instantiated up front, even though the whole product was thread-driven and only one assistant profile needed to be active for a given thread. That was not a subtle philosophical disagreement. It was redundant runtime behaviour. It reflected an ownership problem.
The uncomfortable part was this: I did not even know it was happening.
I did not know because I had not written all the code. I did not know because reading every changed file was too slow. I did not know because I had no good way to step through the system as an architectural workflow.
So at some point the problem became very clear:
I did not have a code generation problem.
I had a code understanding problem.
How Developers Understand Code
This forced me to think about something basic.
How do developers actually understand code?
Not how do we pretend to understand code. How do we really do it?
For me, code understanding is a mental model of flow. Something starts at an entry point. It moves through a module. It calls an object. That object owns some behaviour. A repository owns persistence. An adapter owns a boundary. A service coordinates a decision. Some value crosses from one place to another. Something returns.
That is why we care about abstraction. That is why we care about encapsulation. That is why object-oriented design, when done well, is not just ceremony. It gives us a way to group responsibility into actors we can think about.
We want to know who owns what.
That is also the rule I have been trying to force back into Promet: state, policy, lifecycle, I/O, validation, tracing, and orchestration should have visible owners. If a behaviour matters, it should not hide as a loose helper in a miscellaneous module.
So if ownership and data flow are the things I want to see, then a graph is the obvious shape.
Not a static graph of every possible import. Not a generic repository map. Not a confident AI summary that says “this appears to be a service layer” because it saw a filename called service.py.
I wanted the graph of what actually happened.
The Late-Night Realisation
One late night, while trying to reason through these problems with an LLM, the obvious thing finally landed.
Python can trace itself.
That sounds slightly magical if you have not used the runtime hooks before, but it is very practical. Python exposes introspection and tracing APIs that let a program observe calls, returns, frames, file names, function names, local variables, and selected runtime events while another piece of Python code is executing.
The key hook for Skeleton is sys.setprofile().
In simple terms, sys.setprofile() lets you install a callback function that Python calls when certain execution events happen. For Skeleton, the interesting events are function calls and returns. Skeleton runs the target script inside a controlled runner, observes project-local frames, and ignores local infrastructure like virtual environments, Git internals, and its own .skeleton output directories.
When a call happens, Python gives the callback a frame object. Skeleton reads a controlled slice of that frame: frame.f_code for the code object, file path, function name, and first line number; frame.f_globals for module context; and frame.f_locals for arguments and self.
That is enough metadata to say:
- this function was called
- it came from this file
- it belongs to this module
- it may be an instance method if
selfis present - these are safe summaries of the arguments
When self is present, Skeleton can record the class name and a run-local object identity. That means a report can show that a method ran on a specific runtime instance without adding decorators to the target code. The object identity is not a permanent ID. It is meaningful for that one process and that one run.
On return, the hook receives the return value too, so it can record a safe summary of what came back. Values are summarized immediately, and the raw objects are discarded. When project-local code is already active on the trace stack, Skeleton can also record a small allow-list of resource boundary calls, like stdout, filesystem, SQLite, and basic socket calls.
The shape is roughly:
import sys


def profiler(frame, event, arg):
    if event == "call":
        ...
    if event == "return":
        ...


sys.setprofile(profiler)
try:
    run_the_target_script()
finally:
    sys.setprofile(None)
That is not the full implementation, obviously, but it is the mental model.
There is also sys.settrace(), which is the lower-level tracing hook often used by debuggers. It can observe line-level events, but for Skeleton’s first product shape, line-level debugging is not the point. The useful architectural signal is call and return flow: who called whom, in what order, with what safe value summaries, and where the important boundaries were.
Is this a Python-only idea?
No. The general idea of runtime tracing exists in many ecosystems. Java has profilers, agents, and JVM tooling. JavaScript has browser and Node profiling hooks. Native systems can use instrumentation, sampling profilers, eBPF-style approaches, and platform-specific tracing. Observability vendors do this sort of thing all the time at a different level.
What is special about Python is the cost of getting started. The standard runtime gives you a surprisingly direct path from ordinary user code to structured execution evidence. You do not need to rewrite the application. You do not need decorators everywhere. You do not need the target project to adopt a framework.
You can wrap an existing script or test, observe the runtime, and write artifacts.
That was enough for a first version.
Then Skeleton Appeared
Once the tracing idea was clear, the next question was obvious: how do I make this useful?
A raw trace file is not enough. A dump of events is just another thing to stare at. I needed evidence that a developer could inspect quickly, and that an LLM could consume without guessing from source code alone.
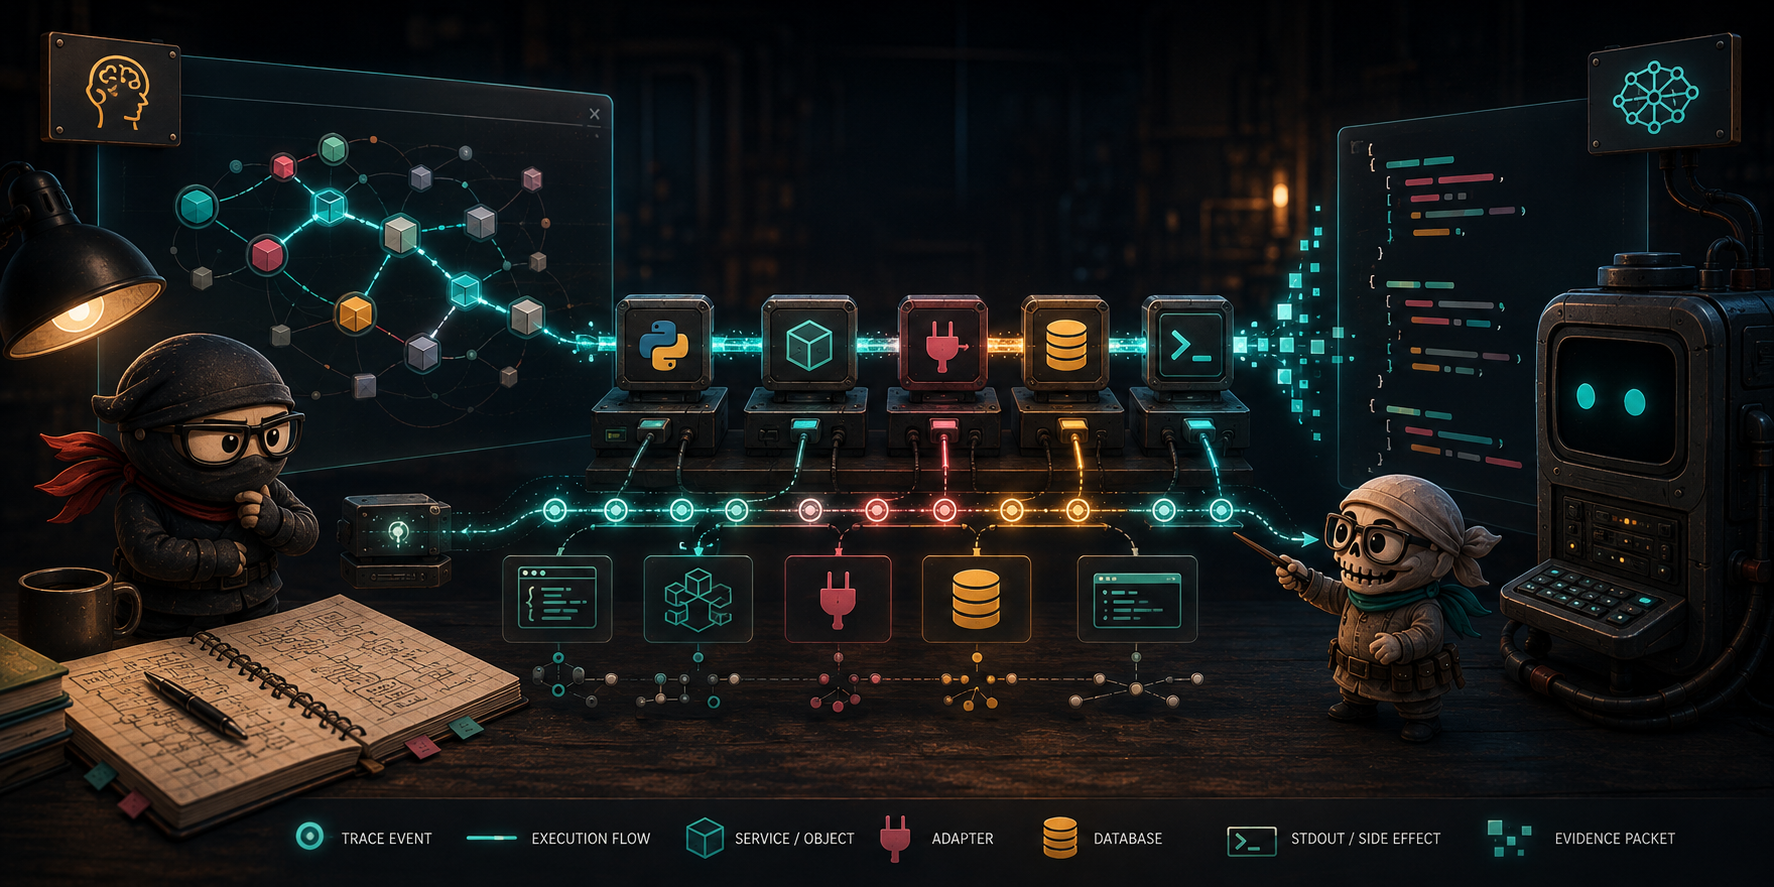
So Skeleton became a pipeline:
The point is not to collect telemetry for its own sake. The point is to turn one execution path into architecture evidence.
The first product decision was that Skeleton should be non-invasive.
You should be able to run:
skeleton run path/to/scenario.py
or:
python -m skeleton_replay run path/to/scenario.py
and get an artifact set beside the scenario.
No decorators. No application-code rewrite. No framework buy-in.
Skeleton walkthrough: trace a run, replay the workflow, export evidence
This slot is for a hands-on Skeleton Replay walkthrough: running a scenario, opening the generated artifacts, moving the trace-window sliders in the report, following runtime events back to source, and exporting the selected window as JSON for a local LLM CLI.
The public project lives on GitHub, the package is published as skeleton-replay, and the IDE loop is exposed through the Skeleton Replay JetBrains plugin.
Skeleton records project-local public calls by default. It summarizes values rather than dumping object contents. It redacts likely secrets. It turns the observed run into a graph. And then it writes outputs that serve different audiences.
What Skeleton Writes
The artifacts are the product.
trace.jsonlis the raw ordered call and return evidence.snapshot.jsonis the derived graph: modules, functions, runtime instances, resources, edges, counts, roles, and architecture views.workflow.mdis the compact written explanation for humans and LLMs.quality.jsonis machine-readable design signal.architecture_quality.mdis a review surface with prompts, warnings, and anchors.report.htmlis the interactive replay for humans.session.jsonis the manifest that lets IDEs and automation find the artifact set.
That separation matters.
I do not want the HTML report to be the only useful object. I also do not want an LLM scraping a visual graph and pretending it understood it. The graph is for humans. The JSON and Markdown are for machines and humans who want a compact explanation.
A Small Mock App To Replay
The example below uses one of Skeleton’s test fixtures. It is deliberately small, because the point is not to impress anyone with scale. The point is to make the runtime boundary visible enough that you can reason about it.
The mock application looks like this:
tests/fixtures/sample_io_boundaries/
|-- app.py
|-- order_domain.py
|-- order_service.py
|-- order_repository.py
|-- notification_adapter.py
`-- .skeleton/
    |-- trace.jsonl
    |-- snapshot.json
    |-- workflow.md
    |-- architecture_quality.md
    |-- quality.json
    |-- session.json
    `-- report.html
The app registers an order. app.py composes the objects, OrderService owns the use case, OrderRepository and OrderNotifier are ports, SqliteOrderRepository owns SQLite persistence, ConsoleNotifier owns stdout, and Order is the domain object.
From a static read, the design looks straightforward. There is a service, a repository, a notifier, and a domain object. That is useful, but it is still only the source-code view.
The traced run shows the observed path:
app.main
  -> app.bootstrap
  -> OrderService.register_order
     -> SqliteOrderRepository.save
        -> filesystem
        -> database
     -> SqliteOrderRepository.load
        -> database
     -> ConsoleNotifier.announce
        -> Order.display_label
        -> stdout
That one run produced 33 events, 29 runtime nodes, and 12 runtime edges. The quality pass also found 19 resource-boundary events across file, database, and stdout access. It flagged order_repository as a medium-severity runtime hotspot because that module concentrated the persistence work and resource-boundary activity.
That does not automatically mean the repository is wrong. In this fixture, the repository is supposed to own persistence. The value is that the report gives the reviewer and the LLM a precise place to discuss boundary pressure: if the next vibe-coded change adds receipts, email, retry queues, or external calls, you can check whether the new behaviour stays behind the right adapter or starts leaking into the service and domain layers.
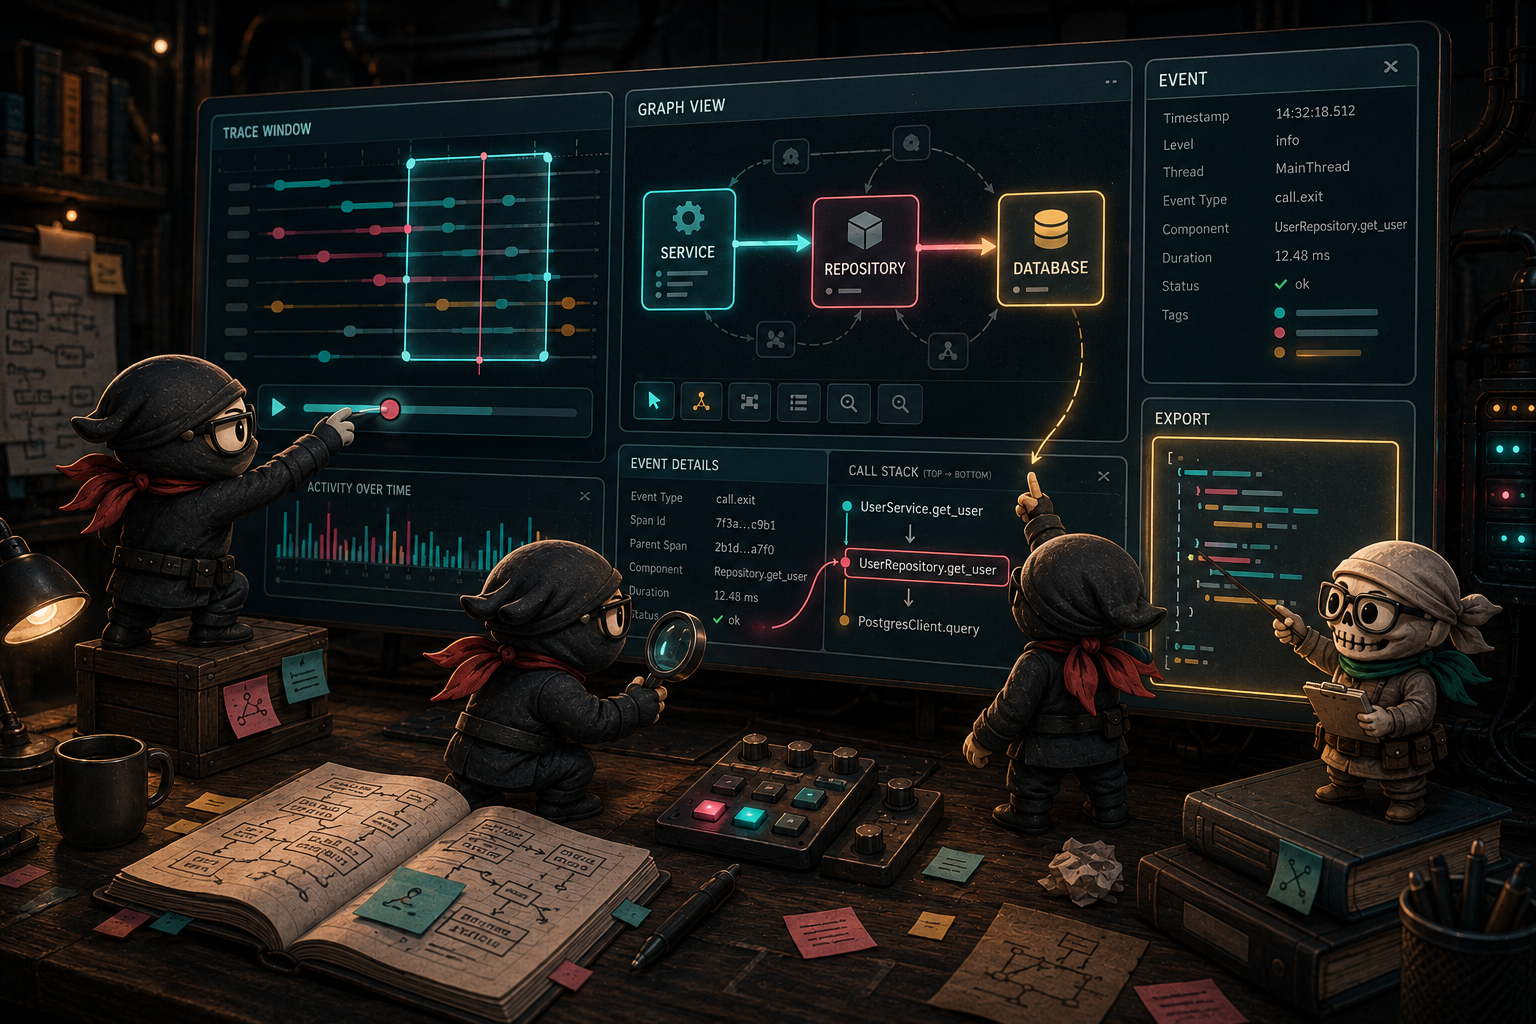
This is close to how I want to use Skeleton while working with an LLM CLI. I do not want to ask the model to “look around the repo” and hope it builds the same mental graph I have. I want to run the scenario, inspect the workflow, choose the part that looks suspicious, and hand the model the exact evidence for that window.
The Report Is A Workbench
The HTML report is where the idea becomes visible.
It uses a browser-based graph view, currently built around Cytoscape.js, with a replay timeline. As you move through events, the graph shows the runtime actors and relationships that have appeared so far. You can inspect a function call, see a safe summary of the arguments, see the return, and understand which actor was involved.
This is the part that matters for human understanding.
Developers do not think only in files. We think in flow. We think in paths. We think in responsibility moving from one actor to another.
The report gives that shape back to us.
And then the PyCharm plugin closes the loop.
The plugin is deliberately a frontend over Skeleton. It does not trace Python itself. It invokes the configured Skeleton runner, reads session.json, embeds report.html, shows the workflow and quality outputs, and can follow selected report events back into the IDE.
That is where the loop starts to feel practical.
Run the scenario. Replay the graph. Click the event. Let the IDE take you back to the source context that produced it.
The point is not to make another report that lives beside the code. The point is to make runtime evidence usable while you are still thinking about the code.
Why This Helps The LLM Too
The human side is only half the story.
The other half is the LLM that is writing or modifying the code.
There is an easy trap here. Because the LLM created the modules and classes, we assume it understands how the code runs. But the model is still working from text, context windows, retrieved snippets, diffs, and whatever evidence we give it.
It can infer. It can summarize. It can sound confident.
But inference is not runtime evidence.
A model that wrote the code still benefits from being shown what the code actually did.
This is where Skeleton becomes more than a visualization.
A human can use the graph. The LLM can use workflow.md, snapshot.json, and selected trace-window exports. If I isolate a section of the workflow, I can hand the model a structured JSON packet that says: here are the events, here are the actors, here are the safe arguments, here are the returns, here is the call path.
That is why the report has trace-window sliders. A human can drag the handles around the part of the run that looks interesting: the service calling into persistence, the adapter crossing stdout, the moment a branch appears, or the span where an object is instantiated too early. The graph makes that slice perceptible.
The export button turns the same slice into JSON. The graph is for human perception; the JSON is for LLM perception.
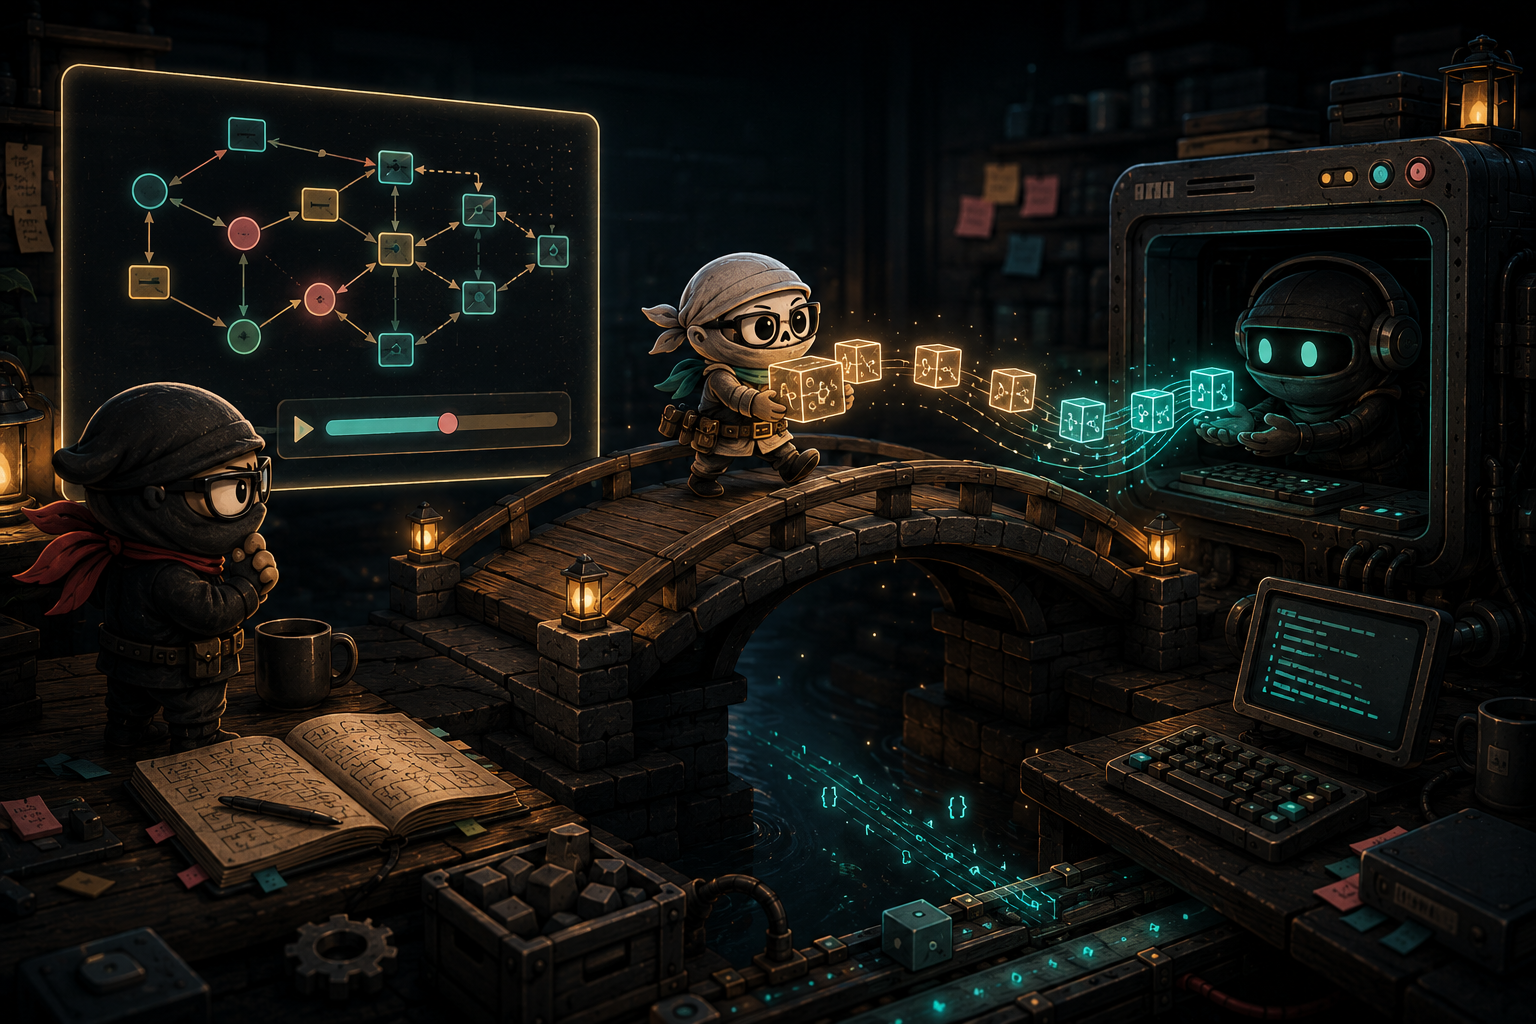
An export is shaped for a local LLM CLI rather than for a screenshot:
{
  "kind": "skeleton_trace_window",
  "selected_window": {
    "start_event_index": 5,
    "end_event_index": 30,
    "event_count": 26
  },
  "llm_note": "This export contains the exact Skeleton execution-window events selected in the replay UI.",
  "events": [
    {
      "order": 5,
      "event_type": "call",
      "caller": {"qualified_name": "app.main"},
      "callee": {"qualified_name": "order_service.OrderService.register_order"}
    }
  ]
}
That example is abbreviated, but the intent is the important part. The model receives stable runtime evidence instead of a visual impression. A useful prompt becomes:
Use this Skeleton trace-window JSON as runtime evidence. Do not infer from filenames alone.
Explain which actor owns the persistence boundary in this selected run, and suggest the smallest refactor if a new notification feature would leak I/O into the service layer.
That is a much better conversation.
Instead of asking the model to guess from source:
“Please inspect this codebase and tell me how the email approval path works.”
I can ask:
“Here is the runtime evidence from the email approval scenario. Explain which actor owns the approval boundary and whether the call path matches the intended design.”
Those are different tasks.
The first asks the model to infer the architecture.
The second asks it to reason from evidence.
The Real Bridge
This is the part that excites me most.
Skeleton sits between the vibe coder, the reviewer, and the LLM.
The human needs visual understanding. We need to see the path. We need the workflow. We need to know which actors appeared at runtime and whether ownership looks sane.
The LLM needs structured evidence. It does not really benefit from a pretty graph in the same way we do. It benefits from stable IDs, JSON, Markdown, call records, safe summaries, and a compact explanation of what happened.
Skeleton gives both sides the version they can use.
The graph helps the human see the workflow.
The structured artifacts help the LLM reason about it.
That is the bridge.
And it is a bridge I now think we need more and more as AI-assisted codebases grow quickly.
The AI Work Around The Model
This is also why I think the current AI engineering conversation can be misleading.
It is natural to look for the model-layer keywords first: PyTorch, TensorFlow, fine-tuning, evaluation harnesses, embeddings, RAG, multimodal generation, reinforcement learning, and whatever else is current. Those skills matter. I am not arguing otherwise.
But if you are building an applied AI product, the model is only one part of the system.
The surrounding harness has to make the model useful under real constraints. It has to route intent. It has to decide which tools are visible. It has to keep credentials out of prompts. It has to ask for approval before side effects. It has to stream enough progress to feel alive without lying about completed work. It has to preserve evidence. It has to recover when the model emits malformed output. It has to keep the user’s durable record distinct from model-generated summaries, retrieval results, and temporary trace artifacts.
That is not glamorous in the same way as training a model.
But it is the layer where trust is either earned or lost.
A capable model does not become a dependable product until the harness around it can explain, constrain, and replay what happened.
This is the lesson Promet keeps teaching me. The private project is the place where I am wrestling with local runtimes, voice interaction, memory boundaries, tool safety, and product feel. Skeleton is the public artifact that came out of one repeated frustration inside that work: I needed runtime evidence for code I could no longer understand quickly enough by reading it.
Promet can stay private for now.
The lesson does not have to.
What Skeleton Is Not
There is an honest limitation here.
One run is not the whole system.
If you trace one scenario, you have evidence for that scenario. You have not proven every possible path. You have not replaced tests. You have not solved architecture by drawing a graph. You have not built an observability vendor. You have not magically made messy code clean.
That distinction matters.
Skeleton is not a profiler. It is not primarily trying to answer “which function is slow?” It is not a debugger. It is not a replacement for code review, tests, design discipline, or explicit ownership.
It is a developer-understanding tool.
It helps you ask better questions:
- What actually ran?
- Which actor owned this behaviour?
- Which function called which function?
- Did a supposedly clean boundary get bypassed?
- Did we instantiate things we did not need?
- Did the path match the architecture we thought we had?
- What evidence can I give the next LLM or reviewer?
That is already enough.
Why This Matters Now
The reason I care is not that I want another tool in the toolbox.
The reason I care is that AI-assisted development creates a new understanding gap.
We can generate code faster than we can review it. We can grow systems faster than we can update our mental models. We can ask LLMs to summarize repositories, but a plausible summary is not the same thing as observed behaviour.
So the answer cannot always be “go read the code.”
Sometimes the answer has to be:
Run the scenario. Generate the evidence. Replay the workflow. Then talk about the architecture.
That is what Skeleton is for.
It gives me a way to understand the local assistant harness I am building. It gives the LLM a way to corroborate its own understanding. It gives reviewers a way to discuss runtime behaviour without arguing from vibes.
That is the point: if AI helps us create software faster, our understanding tools have to become more concrete, more inspectable, and more evidence-driven.
If you are building a fast-growing Python system with AI assistance, pick one important scenario and run it.
Generate the trace. Read the workflow. Replay the graph.
Then ask the more useful question:
Does the system that actually ran match the system we thought we had?